Age uncertainties
Analytical uncertainties
Age uncertainties may be calculated using a first-order analytical error propagation approach for all equilibrium U-Pb age calculations. For disequilibrium ages, they are are currently only available for single analysis \(^{206}\mathrm{Pb}^*\), \(^{207}\mathrm{Pb}^*\) and \(^{207}\mathrm{Pb}\)-corrected ages. To use this approach, select the analytical check box on the first tab of the main window.
Monte Carlo uncertainties
Monte Carlo uncertainty calculations can be more accurate than analytical approaches when uncertainties on the input variables (e.g., analytical uncertainties, activity ratios, etc.) are relatively large, and the output age distribution is significantly non-Gaussian. However, Monte Carlo approaches can deliver unreliable results when a large number of trials fail, or when a large number of simulated variables take non-physicial values (e.g., negative simulated activity ratios). To avoid these problems going unnoticed, DQPB performs checks on Monte Carlo data inputs and outputs, and alerts the user of any potential issues (see the section below).
Monte Carlo age uncertainties are available for all age types. To use this approach, select the Monte Carlo check box on the first tab of the main window.
Disequilibrium ages calculated with near equilibrium [\(^{234}\mathrm{U}\)/\(^{238}\mathrm{U}\)]m values
One case in which Monte Carlo uncertainties can be unreliable is when a disequilibrium age is computed using a measured [\(^{234}\mathrm{U}\)/\(^{238}\mathrm{U}\)] activity ratio with an assigned uncertainty that significantly overlaps radioactive equilibrium. In this case, it’s likely that a large number of Monte Carlo trials will fail to return convergent age solutions and this makes the results unreliable (or at least, difficult to interpret).
This issue may be demonstrated using a synthetic Tera-Wasserburg data set. If we begin by assuming a true age of 1.80 Ma, an initial \([^{234}\mathrm{U}/^{238}\mathrm{U}]\) value of 1.5, and an common \([^{207}\mathrm{Pb}/^{206}\mathrm{Pb}]\) value of 0.83, the true slope of the discordia line will be -0.0002275. We can generate 5 simulated data points along this line, and perturb them according to assigned measurement uncertainties (ignoring uncertainty correlations here for simplicity). We then perform a linear regression using the York algorithm, i.e., model 1 (see Fig. Fig. 6).
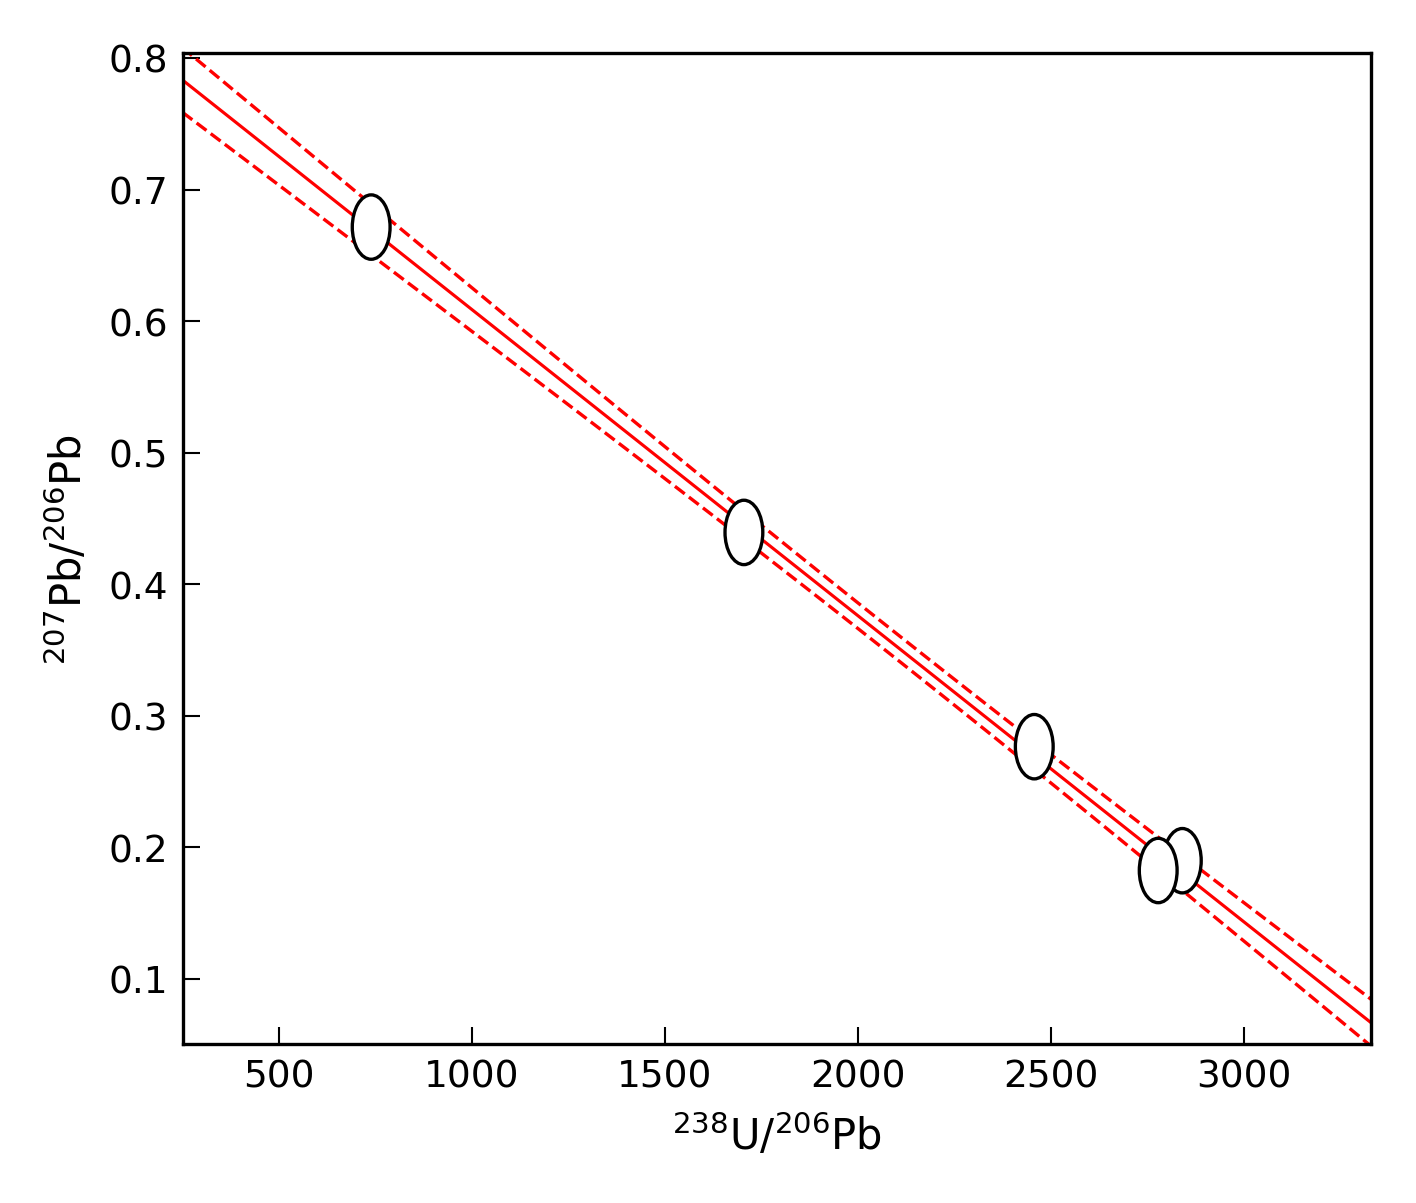
Fig. 6 Linear regression of simulated data set with a true age = 1.80 Ma and \([^{234}\mathrm{U}/^{238}\mathrm{U}]_{\mathrm{i}}\) = 1.5.
The present [\(^{234}\mathrm{U}\)/\(^{238}\mathrm{U}\)] value can be calculated from the known age and initial [\(^{234}\mathrm{U}\)/\(^{238}\mathrm{U}\)], giving \([^{234}\mathrm{U}/^{238}\mathrm{U}]_{\mathrm{m}} = 1.0031\). To this value, we may assign an arbitrary (but realistic) measurement uncertainty of 0.0014 (\(2\sigma\)). Performing a Monte Carlo simulation with 10 000 trials using these inputs, gives an age of 1.810 (95% CI) (1.754, 1.878) ka and a \([^{234}\mathrm{U}/^{238}\mathrm{U}]_{\mathrm{i}}\) solution of 1.514 (95% CI) (1.343, 1.658). The results of the Monte Carlo simulation are shown in Fig. Fig. 7. Only 1 of the 10,000 trials failed. Such a small number will not affect results, and so we may consider the uncertainties calculated from this simulation to be reliable.
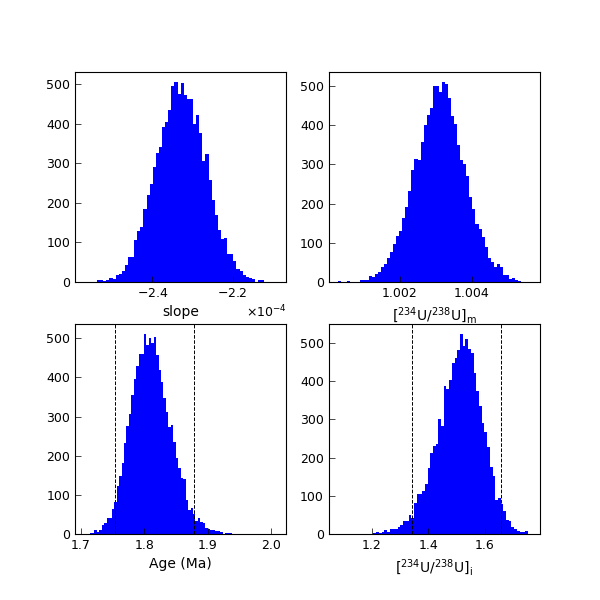
Fig. 7 Monte Carlo simulation results for simulated data set with true age = 1.800 Ma and measured \([^{234}\mathrm{U}/^{238}\mathrm{U}] = 1.0031 \pm 0.0014 (2\sigma)\). Red bars indicate values for all trials, and blue bars indicate values for successful trials only. Note that the blue bars overlay the red bars, which are not visible in this plot because virtually all Monte Carlo trials were successful.
We can repeat this simulation using a true age of 2.4 Ma, but keeping the initial [\(^{234}\mathrm{U}\)/\(^{238}\mathrm{U}\)] and common [\(^{207}\mathrm{Pb}\)/\(^{206}\mathrm{Pb}\)] values the same. This yields a measured [\(^{234}\mathrm{U}\)/\(^{238}\mathrm{U}\)] value of \(1.00057 \pm 0.0014 (2\sigma)\), which overlaps the radioactive equilibrium value significantly. We now repeat the data point simulation and re-fit the linear regression for the slope corresponding to 2.40 Ma (see Fig. Fig. 8).
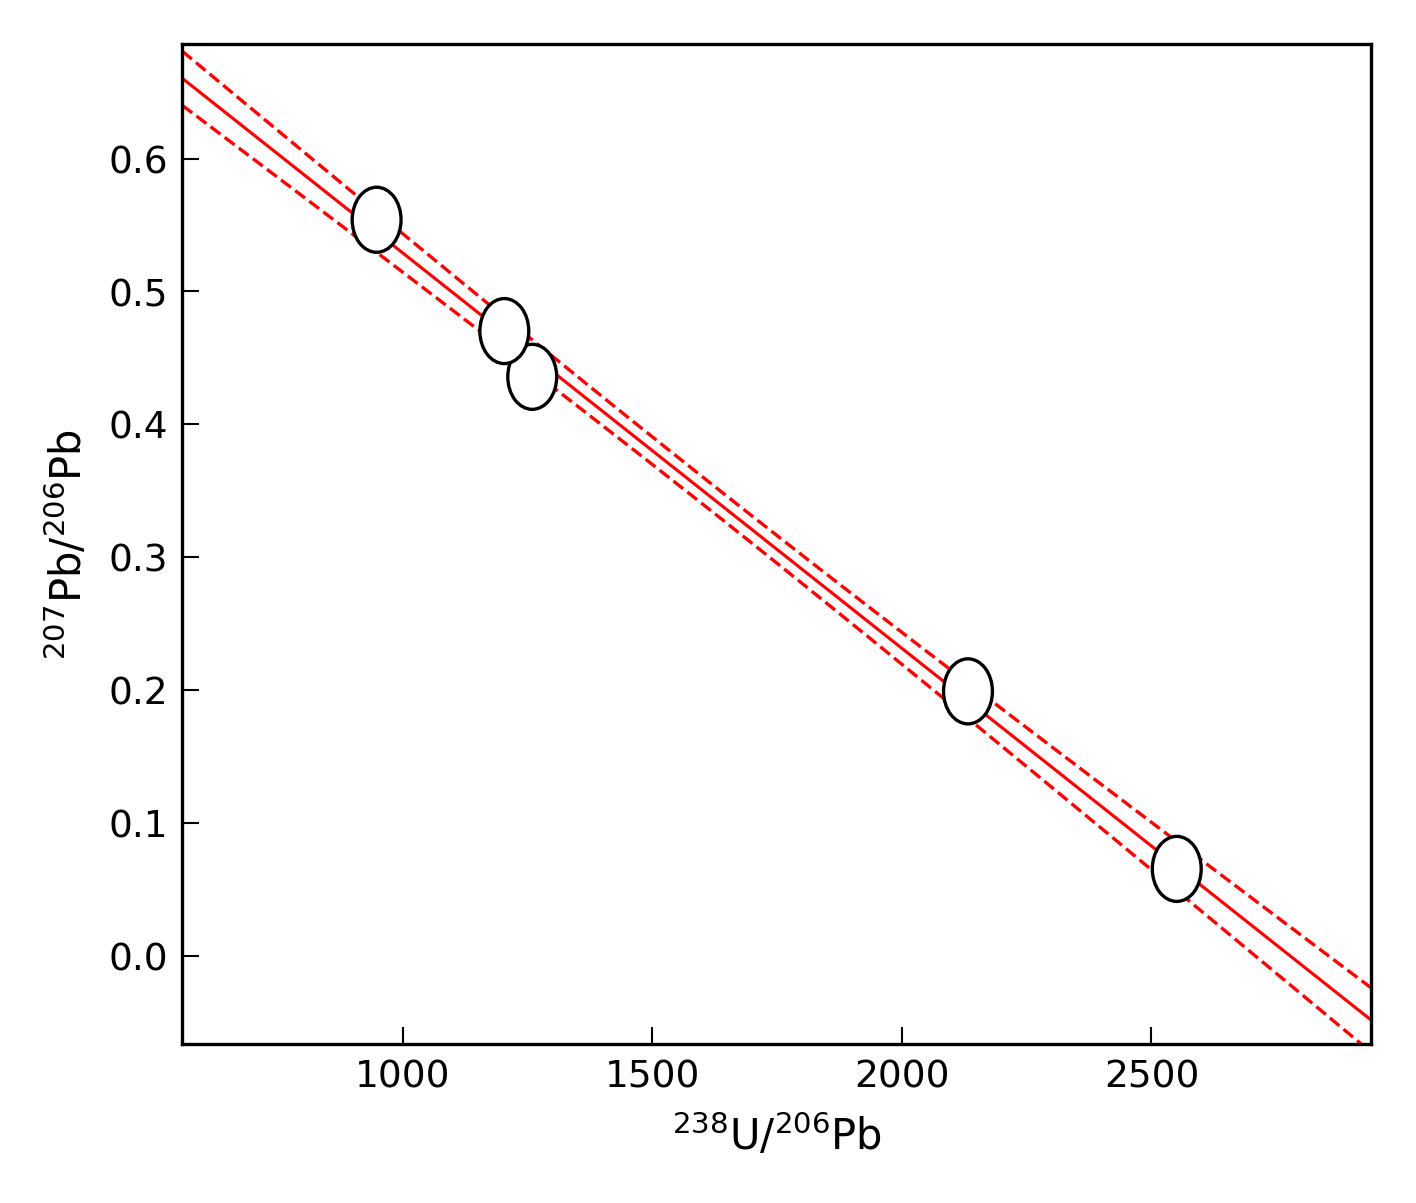
Fig. 8 Linear regression of simulated data set with a true age of 2.40 Ma and \([^{234}\mathrm{U}/^{238}\mathrm{U}]_{\mathrm{i}}\) = 1.5.
Performing 10,000 Monte Carlo trials with these new inputs, gives an age of 2.390 (95% CI) (2.199, 2.714) ka and a \([^{234}\mathrm{U}/^{238}\mathrm{U}]_{\mathrm{i}}\) solution of 1.49 (95% CI) (0.62, 2.0). The results of the Monte Carlo simulation are shown in Fig. Fig. 9.
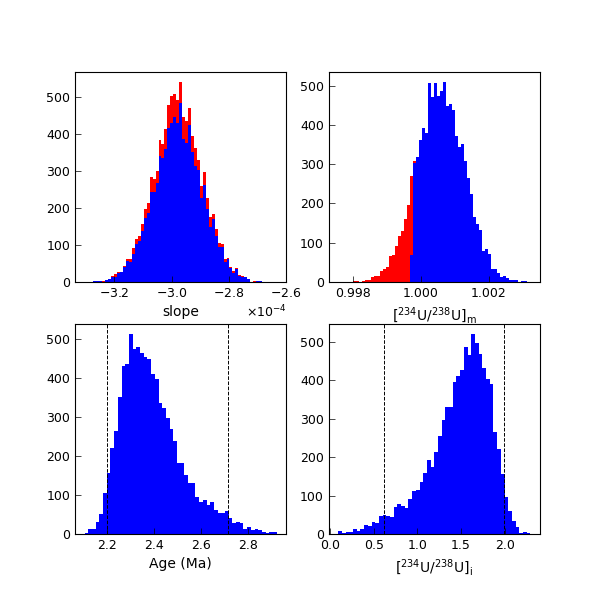
Fig. 9 Monte Carlo simulation results for simulated data set with true age = 2.0 Ma and measured \([^{234}\mathrm{U}/^{238}\mathrm{U}] = 1.00057 \pm 0.0014 (2\sigma)\). Again, red bars indicate values for all trials, and blue bars indicate values for successful trials only. Note that the blue bars overlay the red bars.
This time 1198 of the 10 000 trials failed. This is a significant number, which may bias uncertainties calculated from this simulation. Note that these “failed” trials were not rejected by the algorithm because they returned a negative initial [\(^{234}\mathrm{U}\)/\(^{238}\mathrm{U}\)] value, but rather because there was no convergent age solution available (i.e., the simulated discordia line did not intercept the simulated concordia curve). This can be demonstrated by plotting the concordia curves for the failed trials as Fig. 10.
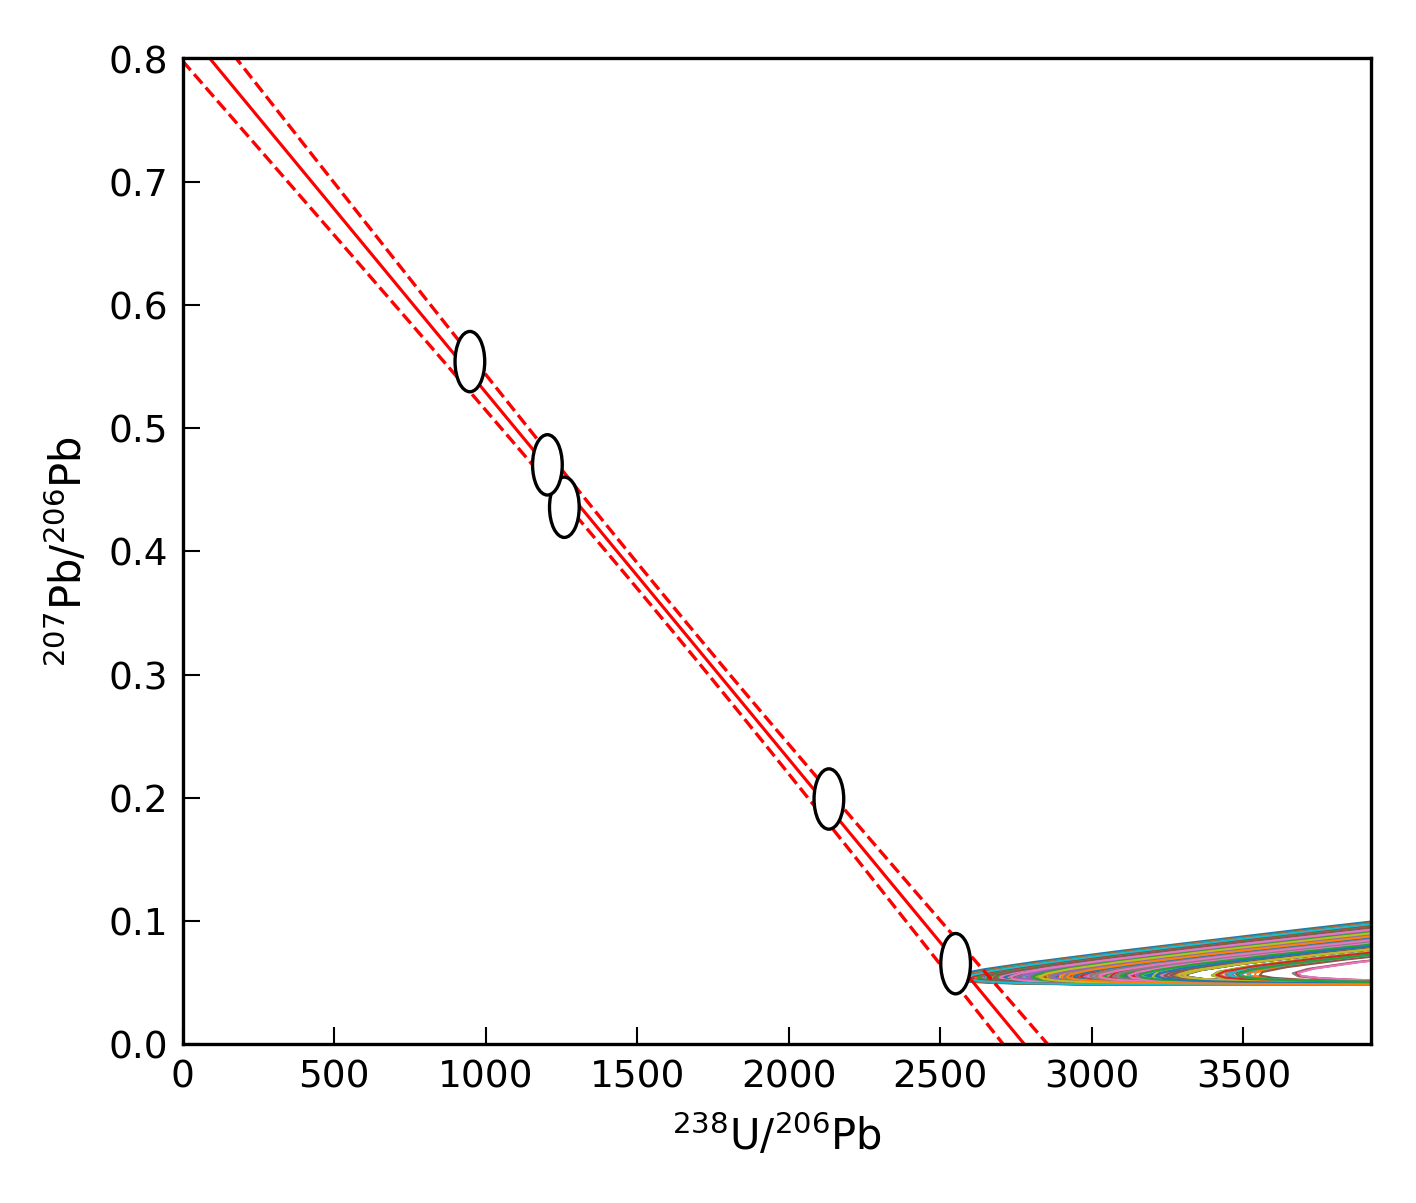
Fig. 10 Linear regression of simulated data set with a true age = 2.40 Ma and \([^{234}\mathrm{U}/^{238}\mathrm{U}]_{\mathrm{i}}\) = 1.5, with the simulated concordia curves for failed trials plotted as the rainbow lines.
To confirm that simulated regression lines do not intercept the corresponding concordia curve for each trial, we plot the simulated discordia lines and zoom in (see Fig. Fig. Fig. 11). Because the resulting plot becomes very cluttered, we only include the first 10 failed trials, but the same thing is observed for all failed trials of the simulation. For further clarity, these simulated concordia curves have been truncated where the age and \([^{234}\mathrm{U}/^{238}\mathrm{U}]_{\mathrm{m}}\) returns a physically impossible negative \([^{234}\mathrm{U}/^{238}\mathrm{U}]_{\mathrm{i}}\) value. We see that the simulated regression lines for these failed trials do not intercept the corresponding concordia curve, meaning that no intercept age solution is available for this combination of inputs to the age equation.
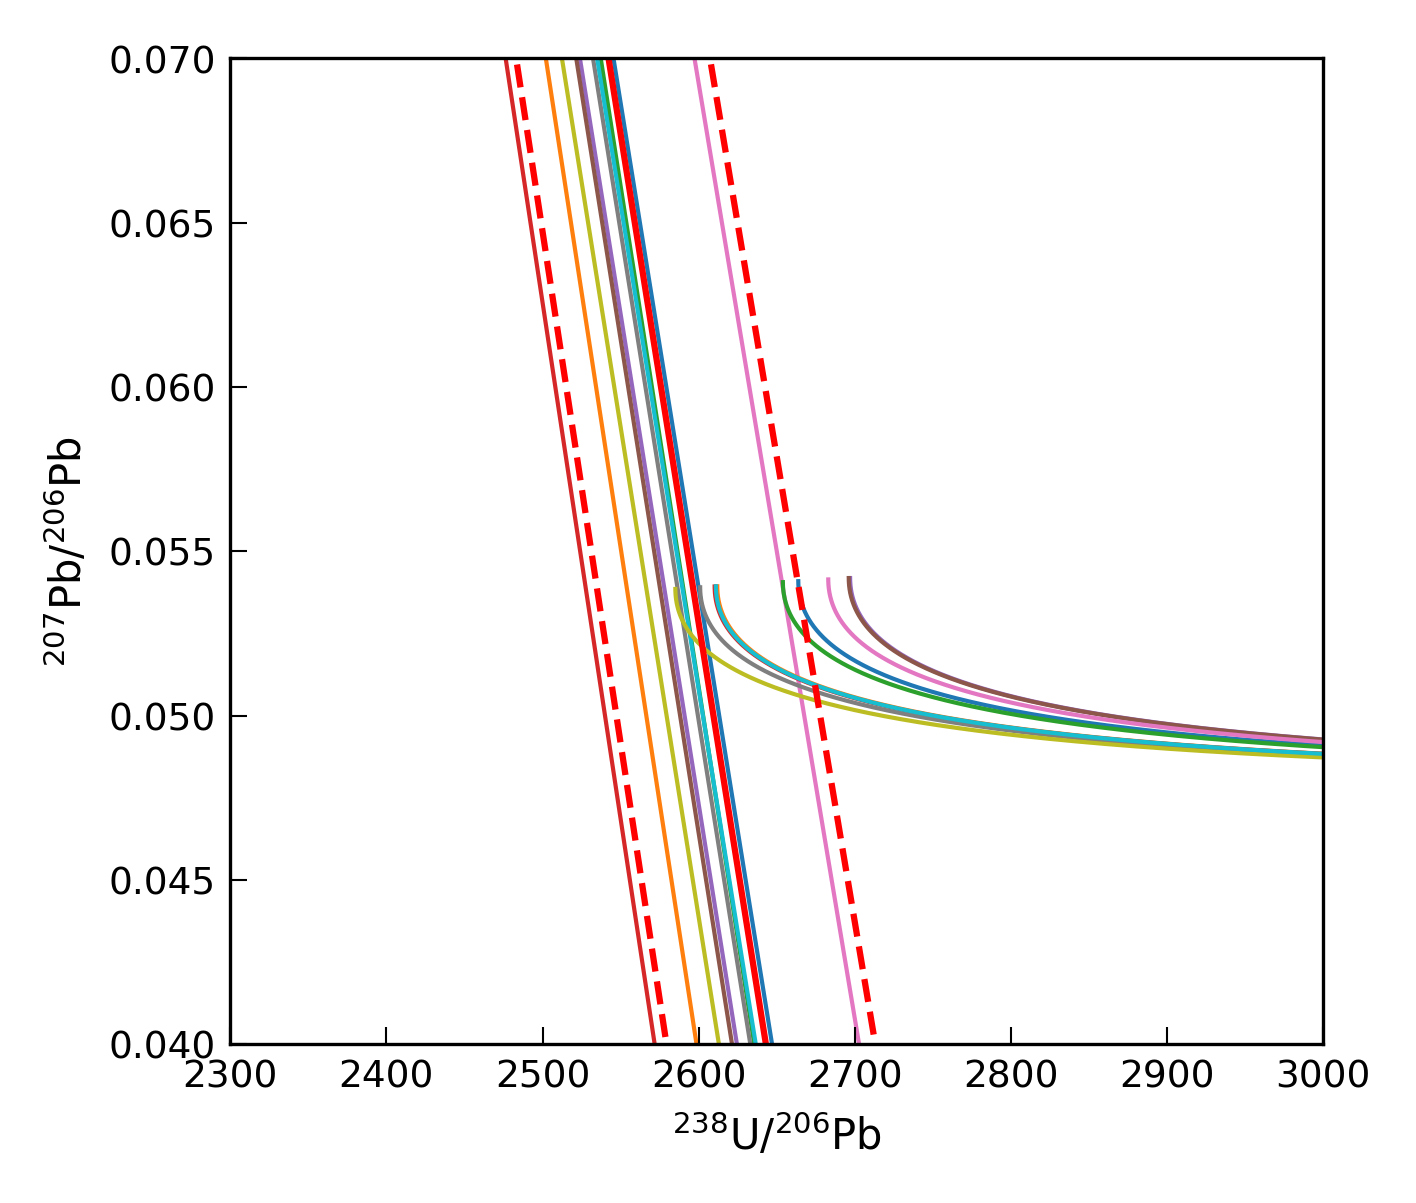
Fig. 11 The same plot as above, but zoomed in. Simulated concordia curves and regression lines for the first 10 failed trials that enter this zoomed in part of the plot are shown. The concordia curves are truncated where age and \([^{234}\mathrm{U}/^{238}\mathrm{U}]_{\mathrm{m}}\) returns a physically impossible negative \([^{234}\mathrm{U}/^{238}\mathrm{U}]_{\mathrm{i}}\) value. Note that regression lines do not intercept the corresponding concordia curve for these trials (indicated by the concordia curve of the same colour).
Monte Carlo quality control checks
To alert users of potential problems with Monte Carlo simulations, DQPB implements two checks when calculating Monte Carlo uncertainties.
Measured activity ratio values are checked before age calculation to ensure that they are analytically resolvable from radioactive equilibrium with 95% confidence. Where this criterion is not met, a warning is displayed (Fig. 12), and the Monte Carlo simulation does not proceed. The age is still reported, but the uncertainties are listed as ‘undef.’ (i.e., undefined).
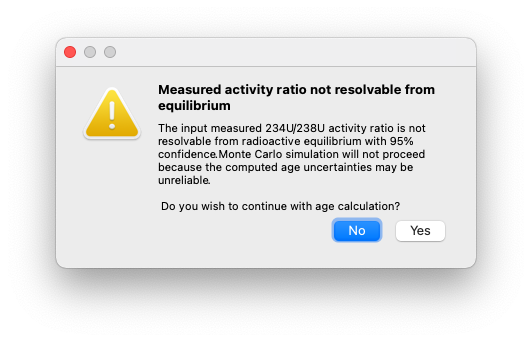
Fig. 12 Measured activity ratio not resolvable warning
After a Monte Carlo simulation is completed, as second check is performed to verify that a minimum proprtion of trials were successful (the default value is set to 97.5%). Where this second criterion is not met, the software displays a warning that Monte Carlo simulation results may be biased by excessive failed trials and should not be used (Fig. 13). This second warning may also be triggered if the PDF of an initial activity ratio value significantly overlaps negative values (e.g., if the value of an initial activity ratio significantly overlaps zero within its uncertainty).

Fig. 13 Monte Carlo failed trials error dialog
Isochron ages calculated with near equilibrium [\(^{234}\mathrm{U}\)/\(^{238}\mathrm{U}\)]m values
The same issue may be encountered when computing \(^{206}\mathrm{Pb}\)/\(^{238}\mathrm{U}\) isochron ages using measured [\(^{234}\mathrm{U}\)/\(^{238}\mathrm{U}\)] activity ratios that are not clearly analytically resolvable from radioactive equilibrium, although this is not as easy to demonstrate graphically. Therefore, measured activity ratio values are checked before age calculation to ensure that they are analytically resolvable from radioactive equilibrium with 95% confidence here too.